Work Log Day 4
Having concluded that I lacked sufficient data and coffee to collect more data, I started to work on model validation and what modifications provided model ‘enrichment’.
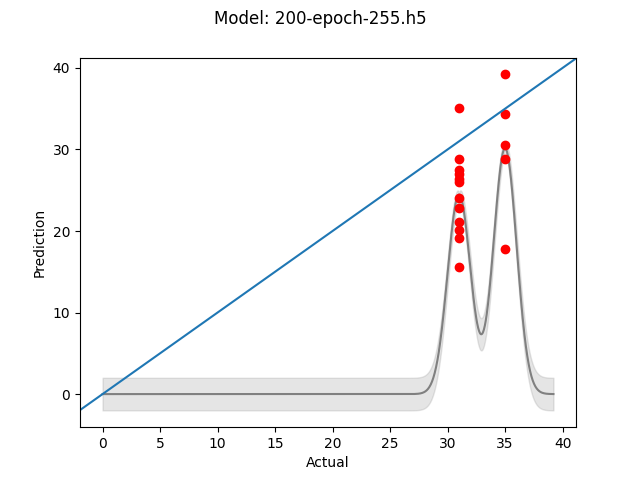
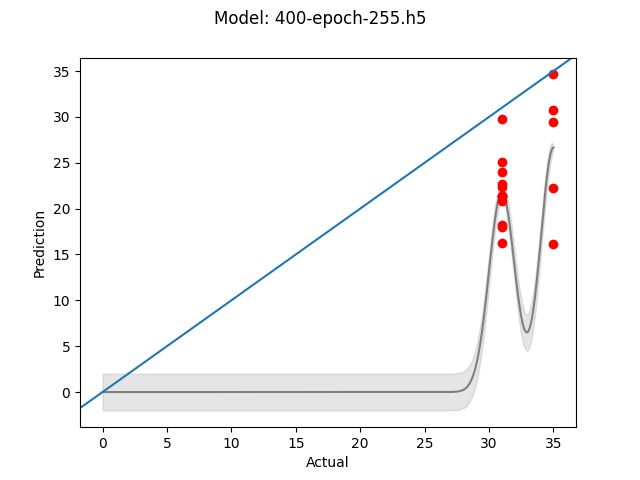
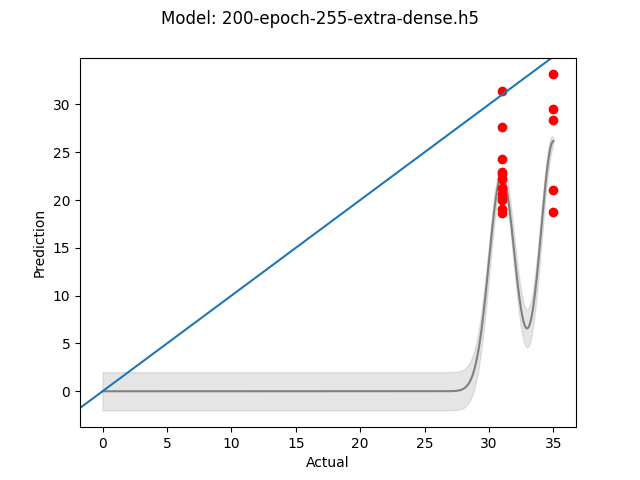
The new optpresso eval command adds support for generating graphs that show the effectivness of the models. A x = y line is drawn along the graph as that is ‘perfect’ performance for the model. The points are graphed along with a Gaussian Process fit along with the 95% confidence interval. The 95% confidence interval is there to help identify where more data needs to be collected. Guessing there is some more tuning to do around Gaussian Process and it might not even be a good way to make a fit. Lots of reading to do on that front, but I have heard good things about it so I wanted to try it.
The first thing I did was simply see how the model behaved with different numbers of epochs with no Keras Callbacks. Epochs don’t seem like a good way to control the amount of training, however it is simple to tune. Running at 200 and 400 epoches for the current model didn’t demonstrate that more training was necessarily better. The image sizes in this case were 255x255, but more on the impact of image sizes/ratios later. Hint, I was doing it ENTIRELY wrong.
Base model - 200 Epochs - 255x255 images
Base model - 400 Epochs - 255x255 images
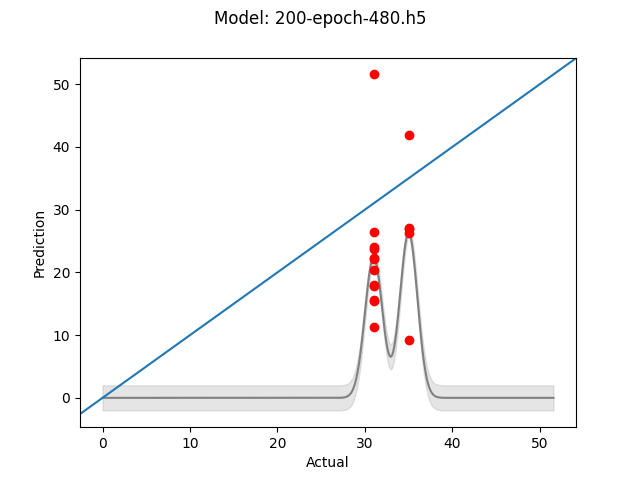
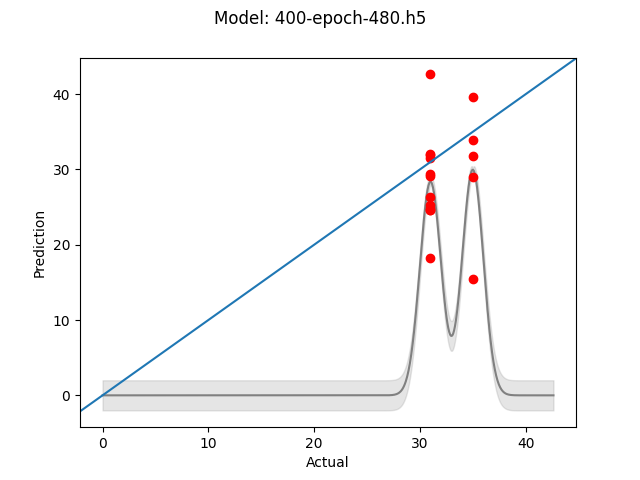
The next test was to see if larger images produce superior results. The thinking here was that the more information available to the model, the more reliably the model to identify features sigificant to the pull time. This time it seemed that more training did help, which would seem to make sense as there is more data upon which to fit. Still both models were off by at least 10 seconds in some cases, not siginificantly different than the smaller images.
Base model - 200 Epochs - 480x480 images
Base model - 400 Epochs - 480x480 images
At this point it seemed that perhaps the model itself wasn’t ideal and found an example that seemed to be solving a similar problem. Looking through the models that had been used, I decided to add a 256 node dense layer, followed by the existing 128 node layer and finally another 64 node layer. All using the LeakyReLU activation function and with the finaly 64 node layer using a Dropout layer of 50%. Based on the example above it seems that dropout may not be well suited to regression issues, though that was kept to maintain consistency with the base model.
These additional layers didn’t provide any improvement, though I imagine as more data is collected it might be worth investigating again. Below are comparing the original 200 epoch model to the denser 200 epoch model.
Base model - 200 Epochs - 255x255 images

Extra Dense Layers model - 200 Epochs - 255x255 images
At this point I started to think about data again. Without good data, I can’t expect great results. Ignoring the quality of the images, a lab grade microscope would be absurd, I started thinking about how well I could identify the differences in small grinds. It was then that I realized I was converting 4:3 images to 1:1, which would have skewed the shapes and sizes of the grinds which seem pretty crucial. Running the model again with the images in their original aspect ratio at 640x480 I found the results got significantly better.
Base model - 200 Epochs - 640x480 images
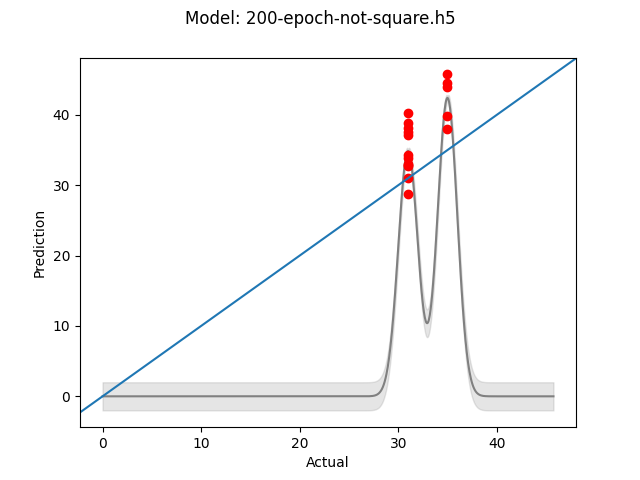
This points out a need to look at the data being passed to the model and not just trust keras to do ‘the right thing’. Definitely an oversight on my part, just glad to have gotten some more predictive results. It is likely too early to really make that claim due to the lack of data, however it is promising and that is enough.
Tomorrow the bulk coffee I ordered should arrive and I will be able to expand my training and test sets (the test set doubles as a validation set, until I have more data to work with). Will also start documenting other parts of the setup in case it ends up being useful in the future.
What I Learnt and What I Need to Investigate
Learnt
- Image size/ratio matters in regression problem
- Epoches don’t promise better results (not surprising, but nice confirmation)
- Dense layers don’t magically improve things (duh)
To Investigate
- Evaluating the models without looking at them (R^2?)
- Try all of the models in the self-driving car example
- Try different activation functions.